Results from a refined iterativeWGCNA network analysis. The file includes two tables in separate tabs.
- Gene Membership: full listing of the 15,886 expressed genes in the dataset and their module and meta-module membership. This table provides gene names, select gene functional classification annotation (T2D associated genes, transcription activity, signaling molecule and lncRNA), meta-module and module assignment in the network, eigengene connectivity (kMe), gene expression profile, and gene expression values in each sample (averaged normalized counts).
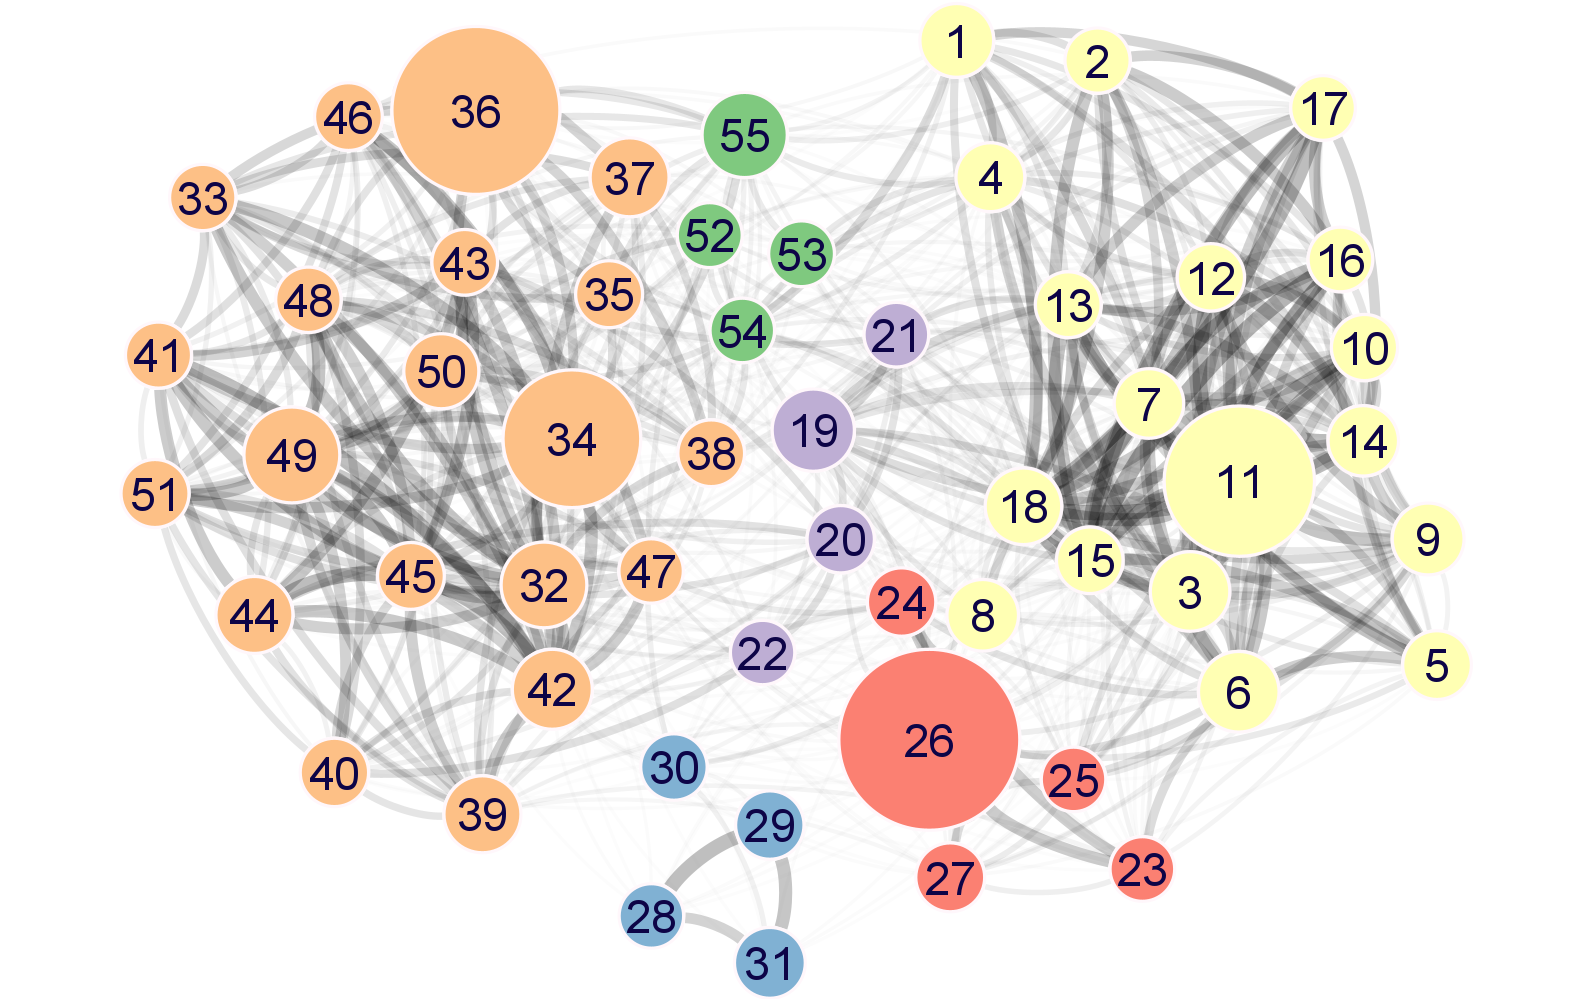
- Modules: details on the 55 module detected by our analysis, including module size, module-density, and module eigengenes
| Enrichment | Module Assignment | Control | Control | Tolbutamide | Glucose | Tol+CREB inhibitor | Tol+Ver | ||||||||||
|---|---|---|---|---|---|---|---|---|---|---|---|---|---|---|---|---|---|
| Gene | Is expressed in T2D | Is Transcriptional Regulator | Signal | lincRNA | Meta-module | Module | kMe | Profile | Ctrl - 0h | Ctrl - 24h | Tol - 30m | Tol - 2h | Tol - 6h | Tol - 24h | Glc - 24h | Tol+CREBinh - 24h | Tol+Ver - 24h |
| Gene | T2D expression | TR | Signal | lincRNA | Meta-module | Module | kMe | Profile | Ctrl - 0h | Ctrl - 24h | Tolb - 30m | Tolb - 2h | Tolb - 6h | Tolb - 24h | Glc - 24h | Tolb/Creb - 24h | Tolb/Vera - 24h |
Legend
- The data columns are averaged condition samples (N=3).
- Enrichment (T2D Expression, TR, Signal, lincRNA): Enrichment is indicated as "1"
- Module: UNCLASSIFIED is indicated as "U"
- Meta-Module: UNCLASSIFIED is indicated as "U"